


Table of Contents
Every vendor in this market publishes a list of Gemini visibility metrics. Almost none of them publish the arithmetic. You are told to track Share of Voice or a Visibility Score, then sent to a pricing page to find out what the number actually is. That gap is the reason most teams cannot reproduce their own reporting, or explain to a finance director where a figure came from.
This guide gives the formula for each metric. It also covers the sampling method that makes those formulas trustworthy, plus the free Google report that now does part of the job at no cost.
Gemini AI visibility metrics measure how often, how prominently, and how accurately a brand appears in answers generated by Google Gemini. The core set is answer presence, share of model voice, citation share, prompt coverage, answer position, sentiment accuracy, and recommendation rate. Each one is a proportion calculated over a fixed prompt set run a fixed number of times.
A note on the terms: AEO, GEO, AI SEO
Three labels circulate for this work, so it is worth settling them before the metrics. Google defines both in its own guide: “‘AEO’ stands for ‘answer engine optimization’ and ‘GEO’ for ‘generative engine optimization’. These are both terms you may see used to describe work specifically focused on improving visibility in AI search experiences.”
Google then declines to treat it as a separate discipline: “From Google Search’s perspective, optimizing for generative AI search is optimizing for the search experience, and thus still SEO.”
That position is reasonable for Google Search. It does not remove the measurement problem, since standard SEO reporting was never built to describe an answer that names four competitors in one paragraph. The terminology is settled; the arithmetic is not.
Start with the free report most guides still ignore
On 3 June 2026 Google announced a Generative AI performance report inside Search Console. Google describes it as covering “generative AI features on Search, such as AI Overviews and AI Mode, as well as generative AI features in Discover”.
Before paying for anything, check whether your property has it. Google is explicit that the rollout is partial: “We are rolling these reports out to a subset of websites, allowing us to thoroughly test them and receive feedback before making them widely available.”
Know its limits before you build a report around it. The Search Console help page defines the metric narrowly: “Impressions are how many times links to your site were shown to a user in a generative AI feature on Google Search.” The available dimensions are impressions, pages, countries, devices, and dates.
Three things are absent, which matter more than what is present. There are no clicks, no average position, no query dimension. AI Overviews and AI Mode are also reported together rather than separately. So the report tells you that Google surfaced your pages in a generative feature, in which country, on which device. It cannot tell you which prompt produced that, nor whether a competitor appeared beside you.
That absence is precisely what the metrics below exist to fill.
Why Gemini needs its own measurement
Two mechanics separate Gemini from a ranked list of blue links.
The first of them is query fan-out, which Google defines in its own glossary as “a set of concurrent, related queries generated by the model to request more information and fetch additional relevant search results to address the user’s query”. When AI Mode launched in March 2025, Google described the technique as “issuing multiple related searches concurrently across subtopics and multiple data sources”.
The practical consequence is that you are never competing for one query. A single user question becomes a set of hidden sub-queries, so a page that answers only the literal phrasing will miss most of the retrieval.
The second mechanic is grounding, and it is the more useful of the two for measurement. When the model grounds an answer in Google Search, the API response carries the sources with it. Google’s developer documentation lists the fields directly: webSearchQueries holds “the search queries used”, groundingChunks holds “the web sources (URI and title)”, groundingSupports links each text segment back to the chunks that produced it.
For anyone able to call the API, those fields are a measurement instrument rather than a debugging aid. They expose which sub-queries ran, which domains were retrieved, which sentence came from which source.
From familiar metrics to Gemini equivalents
Most of what follows has a counterpart you already report. Mapping the two makes the shift easier to explain to anyone who signs off the budget.
| Traditional SEO metric | Gemini equivalent | Why the swap matters |
| Impressions | Answer Presence Rate | An impression counts a listing on a page. Presence counts being named inside the answer itself. |
| Average position | Average Answer Position | Rank moves from a page of ten links to an order inside a single paragraph. |
| Share of search | Share of Model Voice | Measured against brands named in answers rather than against ranking URLs. |
| Backlinks earned | Citation Share | The model picks sources per answer instead of accumulating links over years. |
| Keyword coverage | Prompt Coverage | A prompt set replaces the keyword list, because fan-out hides the real queries. |
| Click-through rate | Recommendation Rate | Many answers produce no click at all, so being shortlisted replaces being clicked. |
| Brand sentiment survey | Positive Mention Rate | Read directly from generated text every month, at almost no cost. |
One column does not transfer cleanly. Traditional metrics come from a log of what happened, whereas every Gemini metric comes from a sample you chose to collect. That is why the prompt set and the run count matter as much as the formula.
The seven metrics, with the formula for each
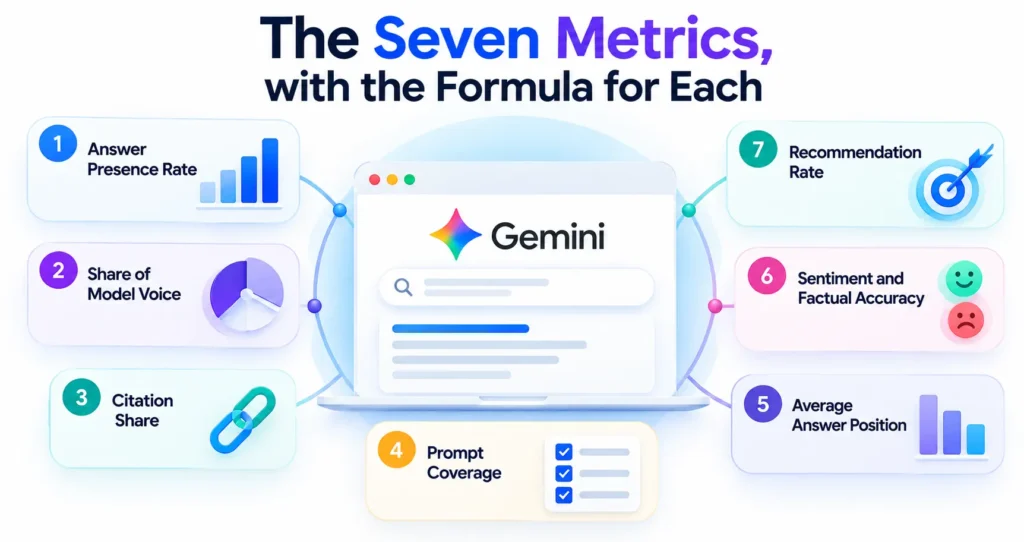
Every metric below is a proportion, which keeps the arithmetic simple. Each one needs the same three inputs. You fix a prompt set of size P, a number of runs per prompt R, giving a total sample of N = P × R answers. Fix those three numbers before you calculate anything, because a score computed over a different prompt set is a different score.
1. Answer Presence Rate
Answer Presence Rate is the share of generated answers that mention your brand at all. It is the base metric, and the one to report first, because every other figure is conditional on being present.
Answer Presence Rate = (answers mentioning your brand / N) × 100
As a worked example, say you run 40 prompts five times each, giving N = 200 answers. If your brand is named in 46 of them, your Answer Presence Rate is 23%.
2. Share of Model Voice
Share of Model Voice is your portion of all brand mentions in the answer set. It answers the competitive question rather than the absolute one, so a rising presence rate with a falling share means the category is growing faster than you are.
Share of Model Voice = (your brand mentions / total brand mentions across all answers) × 100
Count mentions rather than answers, so an answer naming you twice counts as two mentions. Decide the counting rule once, write it into your method note, never change it mid-quarter.
3. Citation Share
Citation Share measures links rather than names. A brand can be described in an answer without its site being the source, which is the difference between being talked about and being read.
Citation Share = (answers citing your domain / answers citing any source) × 100
The denominator matters here. Use answers that cited something rather than all answers, because ungrounded answers cite nobody and would understate everyone equally.
Citation Share also gets easier to act on once you look at what kind of source the model reached for. The types below recur across grounded answers, each pointing at a different job.
| Source type | What tends to get cited | What you can do about it |
| Vendor documentation | Product docs, specification pages, public pricing | Keep specifications and pricing on crawlable pages rather than behind a form |
| Review and comparison platforms | Category listings, user reviews, feature grids | You cannot edit these, so monitor accuracy and respond where the platform allows |
| Editorial publishers | Trade press, industry titles, analyst notes | Earned coverage, which is why public relations now feeds AI visibility |
| Community discussion | Forums, question sites, subject communities | Genuinely useful, though retrieval mixes shift, so never build the plan on one platform |
| Reference works | Encyclopaedic entries, standards bodies, official registers | Accuracy here shapes how the model describes your whole category |
| Your own content | Guides, explainers, original research | The only surface you fully control, usually the smallest share of the total |
Log the source type beside every citation you record. A Citation Share of 8% built entirely on your own blog is a weaker position than the same figure spread across reviews, press coverage, and documentation.
4. Prompt Coverage
Prompt Coverage is the share of distinct prompts where you appear at least once across your runs. Presence Rate can be dragged up by one prompt you dominate; coverage reveals whether your visibility is broad or concentrated.
Prompt Coverage = (prompts with ≥1 appearance across R runs / P) × 100
Report this beside Presence Rate rather than instead of it. A 23% presence rate spread over 60% of prompts is a healthier position than the same rate concentrated in 8% of them.
5. Average Answer Position
When an answer lists several brands, order carries weight. Average Answer Position records where you sit in that list, counted only over answers where you appear.
Average Answer Position = sum of your rank position/number of answers mentioning you
Only count answers that actually enumerate brands. Prose that mentions you once in passing has no position, so including it as rank 1 will flatter the number badly.
6. Sentiment and Factual Accuracy
Being mentioned incorrectly is worse than not being mentioned. Track two separate proportions here, since a positive tone attached to a wrong fact is still a problem.
Positive Mention Rate = (mentions coded positive / total mentions) × 100
Factual Error Rate = (mentions containing a factual error / total mentions) × 100
Code the errors by type rather than logging a count. Outdated pricing, a discontinued product, a wrong location, an attribute belonging to a competitor: each of those points at a different page you need to fix.
An illustrative case: the price that will not die
The following scenario is constructed to show how the accuracy metric behaves, rather than drawn from a named client.
A software company changes its entry pricing in March. Three months later the Answer Presence Rate looks healthy at 31%, so nobody investigates further. The Factual Error Rate sits at 22%, which the team has been treating as background noise.
Coding those errors by type takes an afternoon. Nineteen of the twenty-two errors are the same error: the old price, quoted confidently. Tracing the citations shows why, since the model keeps reaching for a comparison page and a review listing, both of which still carry the March figure.
The fix is not a content programme. It is two emails to the platforms holding the stale figure, plus a dated pricing page that states the current number in plain text. The lesson generalises. A high error rate concentrated in one fact is an operational problem with a short fix. The same rate spread across twenty different facts is a far deeper one, yet you cannot tell the two apart without coding the errors.
7. Recommendation Rate
Recommendation Rate separates being consulted from being chosen. It counts only answers where the model puts you on a shortlist or recommends you, not answers that merely reference you.
Recommendation Rate = (answers recommending or shortlisting you / N) × 100
For most commercial teams this is the metric that correlates with revenue. It is also the hardest to move, because it depends on what the wider web says about you rather than on what your own site says.
Building a prompt set that produces repeatable numbers
A metric is only as stable as the prompt set underneath it. Four decisions determine whether next month’s figure is comparable with this month’s.
The first decision is how many prompts to run. Thirty to fifty is workable for a single product line. Below twenty, one prompt swings the whole score. Above a hundred, the manual version stops being sustainable.
The second is which prompts to choose. Sample across the buying journey rather than around your brand name. A useful split is roughly half problem-stage questions, a third comparison questions, the remainder branded. Branded prompts inflate every metric, so keep that portion small and constant.
The third is how often to re-run the set. Monthly is enough for most categories, whereas weekly produces noise you will misread as movement.
The fourth is whether to include country variants. Google expanded AI Mode to more than 180 countries and territories in English during August 2025, then to over 35 additional languages that October. If you sell in several markets, run the same prompt set per market instead of assuming one score travels.
Freeze the set for at least two quarters. Adding prompts mid-quarter changes the denominator, which changes the score without anything changing in reality.
How many runs, and when a change is real
This is the step almost every guide skips, so it is worth doing properly.
Repeated prompts do not return identical answers. Research published on arXiv in 2024 tested five language models across eight tasks over ten runs each, under settings configured to be deterministic. The authors reported accuracy variations of up to 15% between runs, with a best-to-worst gap reaching 70%. Their summary is blunt: none of the models “consistently delivers repeatable accuracy across all tasks, much less identical output strings”.
A single run is therefore an anecdote. Five runs per prompt is a reasonable floor, and ten is better where the decision matters.
Once you have a proportion, you can state how much confidence it deserves. For a sample proportion, the standard error and the 95% interval are:
SE = √( p̂(1 − p̂) / n )
95% interval = p̂ ± 1.96 × SE
Worked example. Suppose your Answer Presence Rate is 23% over 200 answers. The standard error is √(0.23 × 0.77 / 200), which is 0.0298. The 95% interval runs from roughly 17% to 29%. A move from 23% to 26% next month sits inside that band, so it is not yet evidence of anything.
Two cautions belong with those formulas, and both bite in practice. The simple interval above needs a reasonable number of observations in both directions. A common teaching rule asks for at least ten appearances plus ten non-appearances before the approximation holds. NIST also notes that this simple form is inferior to the Wilson score interval, and can even produce a negative lower limit. Where your proportion sits near zero, which is normal early on, use Wilson instead.
Measuring Gemini visibility without a paid tool
Every vendor page on this topic ends at a subscription. A spreadsheet method works, costs nothing, and has the advantage that you know exactly what it measures.
1. Write your prompt set into a sheet, one row per prompt, with a column for market.
2. Run each prompt in a fresh session, five times, recording the full answer text.
3. For each answer, log four fields: brands named, order of naming, domains cited, any factual error.
4. Calculate the seven proportions above from those logged fields.
5. Record the date, the model version, the prompt count, the run count, beside every figure.
That last step is the one people skip. A score without its method attached cannot be compared with anything later.
Teams with development capacity can automate the citation side. Grounded responses from the Gemini API return the fields listed earlier, so groundingChunks gives you cited domains directly, without anyone reading answers by hand. Presence, order and sentiment still need a human pass, or a second model call with a fixed rubric.
Why you cannot compare scores between tools
Every vendor in this category has invented its own metric name. Share of Model Voice, Share of Answer, Generative Share of Voice, Percent Recommended, Visibility Score. These sound interchangeable, yet each rests on a different prompt set, run count and counting rule.
Two tools reporting “34% visibility” for the same brand in the same week are not disagreeing with each other. They are simply measuring different things. Treat any vendor score as an index to watch over time within that tool, never as a figure to quote beside another tool’s output.
If you must reconcile them, ask each vendor three questions: how many prompts, how many runs per prompt, does the denominator count answers or mentions. Most of the apparent disagreement disappears once those are on the table.
Connecting visibility to pipeline
Visibility metrics describe a surface, not a result. Three bridges get you closer to revenue without pretending to a precision nobody has.
Referral traffic is the only direct signal. Sessions arriving from Gemini carry a referrer, so segment them in analytics and watch the trend rather than the absolute.
Branded search volume is the strongest indirect signal. When a model recommends a company, many people then search that company by name. A rising Recommendation Rate should therefore show up weeks later as rising branded impressions in Search Console.
Self-reported attribution closes the loop cheaply. Adding one optional field to your enquiry form, asking where the person first heard of you, produces data no tracking script can.
Be honest about the ceiling on all three. A conversation inside an assistant leaves no analytics trail, so a portion of the effect will always be invisible. Say that in the report rather than filling the gap with a modelled number.
What belongs in a monthly report
Six items, on one page:
• The seven metrics, each with its confidence interval, not a bare percentage.
• The method line: prompt count, runs per prompt, markets, date of collection.
• Month-on-month change, with movements inside the interval marked as no change.
• The three prompts where you gained, the three where you lost, quoted verbatim.
• Every factual error found, with the page that needs correcting.
• Branded search and referral trend, as the pipeline bridge.
Anything beyond those six items is decoration. A client who can see the method can trust the number, which is the entire point of reporting it.
Does structured data help, or not?
Read three vendor guides on this topic and you will be told that schema markup raises your odds of being cited. Read Google’s documentation and you will be told something that sounds like the opposite: “Structured data isn’t required for generative AI search, and there’s no special schema.org markup you need to add.”
Both statements can hold, because they answer different questions.
Google is describing eligibility, nothing more. No markup gates your entry into a generative answer, so a page without schema is not excluded. Google adds its own reason to keep using it anyway: “However, it’s a good idea to continue using it as part of your overall SEO strategy, as it helps with being eligible for rich results.”
The vendor claim, at its most defensible, is about ambiguity rather than eligibility. Markup states plainly which entity a page describes, which price applies, who wrote it. That reduces the chance a model attaches your description to a similarly named company. Reduced ambiguity is a different mechanism from increased inclusion, though the two get reported as one.
The practical position sits between the two claims. Keep your structured data current for the reasons Google gives. Expect no direct lift in Presence Rate from adding it, then treat any vendor claim about citation odds as a hypothesis you can test. Your own metrics are the instrument for that test, which is the whole argument for calculating them yourself.
What actually moves these numbers
Google is direct that no separate technique is required for its generative features. The optimization guide puts it plainly: “You don’t need to create new machine readable files, AI text files, markup, or Markdown to appear in Google Search (including its generative AI capabilities), as Google Search itself doesn’t use them.” On structure, the same guide says: “There’s no requirement to break your content into tiny pieces for AI to better understand it.”
The evidence on what does help comes from research rather than vendors. The GEO study presented at KDD 2024, built on a benchmark of 10,000 queries, found that methods could “boost visibility by up to 40% in generative engine responses”. The three strongest were citing sources, adding quotations, adding statistics, which together produced a relative improvement of 30% to 40%.
The same study also tested keyword stuffing. It scored 17.7 against a baseline of 19.3 on the paper’s position-adjusted measure, making it the only method tested that finished below doing nothing.
Conclusion
Gemini visibility measurement is not difficult once the arithmetic is written down. Seven proportions, one fixed prompt set, five runs per prompt, and a confidence interval attached to every figure. That is the whole method.
Start with the free Search Console report if your property has access, since it costs nothing and establishes a baseline. Layer the seven metrics on top, because the report cannot tell you who appeared beside you. Then hold the prompt set still for two quarters, which is the only way any of these numbers becomes a trend rather than a reading.
Frequently asked questions
What are Gemini AI visibility metrics?
They are proportions that describe how a brand appears in Gemini-generated answers. The set covers how often the brand is mentioned, what share of all brand mentions it holds, how often its domain is cited. A fourth records how broadly it appears across prompts. Three more cover position in a list, factual accuracy and recommendation rate.
How do I measure visibility in ChatGPT results compared with Gemini?
The same seven formulas apply, since all of them are proportions over a prompt set. What cannot carry across is the prompt set itself or the scores. Run the identical prompts separately per platform, report the results side by side, never average them into one number.
How do I measure AI search visibility across countries?
Run the same prompt set once per market rather than assuming one score travels. Google expanded AI Mode to more than 180 countries in English during 2025, then added over 35 languages, so answers differ by locale. Search Console’s generative AI report also breaks impressions down by country, which gives a free cross-check.
How do I measure AI search visibility against competitors?
Share of Model Voice is the metric for this. Count every brand named across your answer set, then divide your mentions by the total. Track the same competitor list every month, because adding a name changes the denominator and makes the series meaningless.
What is an AI visibility score?
It is a composite index, and each vendor builds it differently. There is no standard definition, no published formula behind most of them, no basis for comparing one vendor’s score with another’s. Use it as a trend line inside one tool, or calculate the underlying proportions yourself.
How many times should I run each prompt?
Five runs per prompt is a sensible floor, ten where the decision matters. Research on model non-determinism found accuracy varying by up to 15% across repeated runs of identical prompts, so a single run tells you very little.
Which KPIs make sense, and which can be ignored?
Report Answer Presence Rate, Share of Model Voice, Citation Share, Recommendation Rate. Treat Prompt Coverage and Average Answer Position as diagnostics rather than headline numbers. Ignore any composite score you cannot reproduce from its inputs.
Does Search Console show AI Overviews data now?
Partly, though less than the name suggests. Google launched a Generative AI performance report in June 2026 covering AI Overviews, AI Mode and Discover, though it reports impressions only. There are no clicks, no average position, no query breakdown, and the rollout reaches a subset of properties rather than everyone.
How do I connect AI visibility to revenue?
Through three bridges: referral traffic from AI platforms, branded search volume as a lagging indicator, and a self-reported attribution field on your enquiry form. None of them captures conversations that stay inside the assistant, so state that limit rather than modelling around it.
How can I avoid vanity metrics in AI visibility tracking?
Attach a confidence interval to every proportion, then treat movements inside that interval as no change. Report the prompt count and run count beside each figure. If a metric cannot be recalculated from logged inputs, it is decoration.